Virgo north arm cavity
(An optics simulation, part of the Finesse examples)

Magalis Loupias
2004
The following shows an example of how the Finesse simulation has been used to characterise an optical system of a large-scale gravitational wave detector. This work was conducted in 2004 during the early days of the commissioning of the Virgo gravitational wave detector in Italy. This example consists of a set of 10 Finesse input files to, step-by-step, examine the details of the 3 km long Fabry Perot cavity that forms the north arm of the detector. The process as well as the results and conclusions are presented in a technical note (see below). This example demonstrates the rich level of details that can and must be explored in even such a simple setup as a two-mirror cavity for constructing a successful high-precision experiment. The step-by-step approach also provides a good work pattern for using numerical interferometer simulations.
The input file
#---------------------------------------------------------------
# 09ne-signal.kat            Input File for FINESSE
#
# Anderson signal for controlling the Theta_y (xbeta)
# motion of the NE mirror. With the right settings
# for the demodulation phases for the quadrants,
# a misalignment of the NE is in first order
# `seen' by one quadrant, while the other is
# only sensitive to NI misalignments.
#
# This is the 10th file in a set of 10, see text.
#
# 05.06.2004 by  Andreas Freise
#------------------------------------------------------------

const fMI 6.264080M    # modultion frequency currently used experimentally
#const fMI 6.264580M   # modultion frequency optimised for simulation

# input laser (dummy)
l i1 6 0 0 nin

s sEO 1m nin nEO1
mod eom1 $fMI .1 1 pm 0 nEO1 nEO2 # phase modulation

######################## NORTH ARM #####################

s sNs 6.19618 nEO2 nMNI1  # as in OptoCad

# North Input Mirror T=11.8%, Loss=1.8%
# (one could also use e.g. T=13.6%, Loss=50ppm)
m MNIAR 0 1 0 nMNI1 nMNIi1     # secondary surface (AR coated)
s sMNI .097 1.44963 nMNIi1 nMNIi2
m MNI 0.864 0.118 0 nMNIi2 nMNI2
#attr MNI ybeta 1u              # some arbritrary mis-alignment

s sNl 2999.9 nMNI2 nMNE1       # cavity length

# North End Mirror T=50ppm, Loss=50ppm
m MNE 0.9999 50u 0 nMNE1 nMNEi1   # primary surface
s sMNE .096 1.44963 nMNEi1 nMNEi2 # fused silica substrate
m MNEAR 0 1 0 nMNEi2 nMNE2        # secondary surface (AR coated)
attr MNE Rc 3530                  # tuned radius of curvature of NE
#attr MNE xbeta -.3u               # some arbritrary mis-alignment

###################### NORTH BENCH #####################

# L1 first large lens after NE
s sN2 1.77 nMNE2 nL1
lens L1 1.02 nL1 nL2

# L2 and L3, small lenses after L1
s sN3 .8996 nL2 nL3
lens L2 -.2 nL3 nL4
s sN4 .2146 nL4 nL5
lens L3 -.1 nL5 nL6
s sN5 .365 nL6 nL7

# beam split into 50% going to B7 and 50% going to Q71, Q72
bs M71 .5 .5 0 0 nL7 nL8 nB7 dump
s sB7 0.97 nB7 noutB7

# beam split again 50/50, for Q71 and Q72
s sN6 .305 nL8 nL9
bs M72 .5 .5 0 0 nL9 nL10 nL11 dump

# lens L4a and Q71
s sN7 .10 nL10 nL12
lens L4a -.1 nL12 nL13
s sN8 .759 nL13 nQ71

# lens L4b Q72
s sN9 .286 nL11 nL15
lens L4b -.1 nL15 nL16
s sN10 .832 nL16 nQ72

########################################################

# Computing the signal for horizontal misalignment
# i.e. a Theat_y motion
pd1 Q71 $fMI -10 nQ71
pdtype Q71 x-split
pd1 Q72 $fMI -3 nQ72
pdtype Q72 x-split

# Computing the signal for vertical misalignment
# i.e. a Theat_x motion
#pd1 Q71 $fMI -10 nQ71
#pdtype Q71 y-split
#pd1 Q72 $fMI -3 nQ72
#pdtype Q72 y-split

# Power on one of the quadrants
pd  Q71DC nQ71
scale 0.003 Q71DC

#misalign NE either horizontally (xbeta) or vertically (ybeta)
xaxis MNE xbeta lin -10u 10u 200
#xaxis MNE ybeta lin -10u 10u 200

cav NC MNI nMNI2 MNE nMNE1
maxtem 12

yaxis lin abs
pause
gnuterm x11
The above file is the last file in a set of 10 input files. The entire set is available for download here (the files have been updated to work with the current version of Finesse): virgo_northarm.zip (16 kB). The simulation procedure and the results are discussed in the corresponding Virgo technical note: VIR-NOT-EGO-1390-269.pdf (1.1 MB).
The optical layout
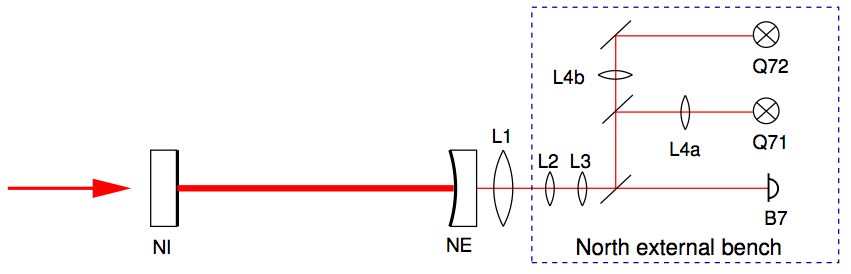
The north arm of the Virgo detector is effectively a two-mirror cavity. However, the various Finesse input are also used to model various additional optical components from the laser injection and the optical readout. These can become rather complex and do have a significant influence on the results. The above optical layout excludes the injection optics but shows the main 3 km long cavity and a simple schematic for the readout optics in transmission of the end mirror.
Output graphs
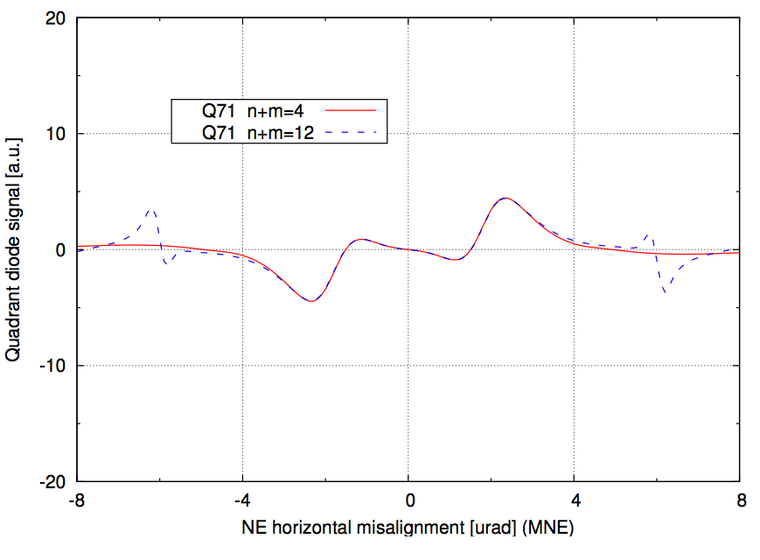
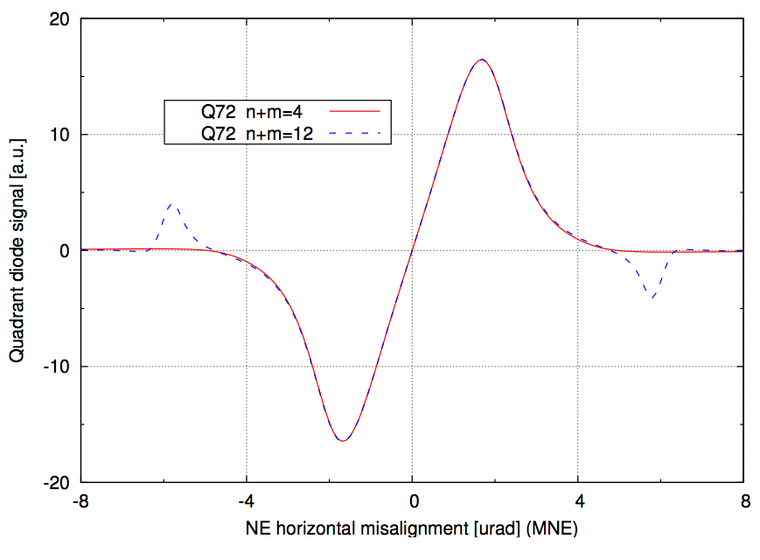
The plots below show alignment error signals, showing that one quadrant camera q71 is not sensitive to small mis-alignments of the end mirror NE whereas the second camera q72 is obtaining a strong signal proportional to such misalignment. This is the result of the tuning of the optical telescopes in front of these cameras and the electronic demodulation phase (which has been done with this and previous input files in the set).
These plots also show that the slope of the signal around the aligned condition can be correctly computed with a low number of higher order modes, whereas many more modes need to be included in the simulation if the effects of larger alignment angles are to be computed.